
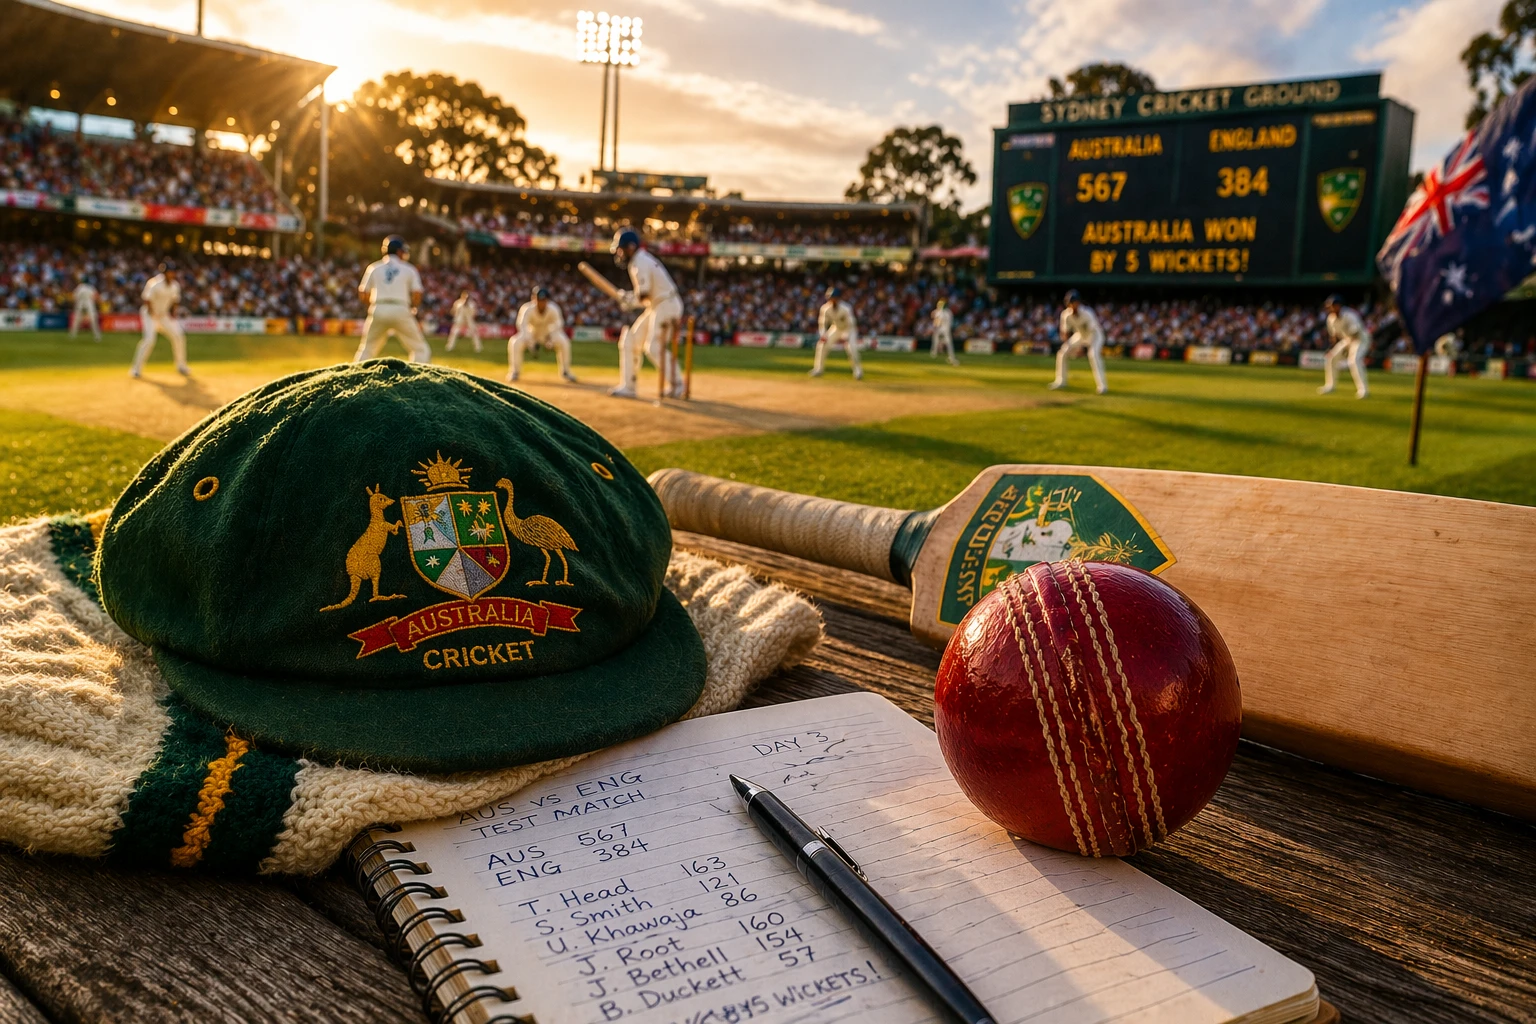
You know what? There is absolutely nothing in sport quite like an Australia versus England cricket match. The tension, the long history, the banter over the fence. It is all part of the summer down under. But long after the stumps are pulled out of the ground, the esky is empty, and the crowd goes home, all we are left with is the match scorecard.
And honestly, that piece of digital or printed paper tells a better story than any video highlight reel. It captures every single moment of the game. Every edge, every dropped catch, every grueling hour spent out in the middle of the pitch. It is all right there.
If you are trying to make sense of an Australian men’s cricket team vs England cricket team match scorecard, you might feel a bit lost at first glance. There are numbers everywhere. Strike rates, economies, maidens, and extras. But do not worry. I am going to walk you through exactly how to read these scorecards.
We will use real context from the battles we see at the MCG, the SCG, and the Gabba. Here is how it works. We will look at the batters, the bowlers, and all the hidden details that show who really won the day. You do not need a degree in mathematics to understand it. You just need to know where to look.
The Morning Ritual of Checking the Score
Let’s set the scene for a second. If the boys are playing over in England, the time zone is a nightmare for us in Australia. You stay up until 2 AM watching the first session. You fall asleep on the couch.
Then you wake up at 7 AM, grab your phone off the bedside table, and refresh the scorecard app. It is a terrifying moment. You squint at the bright screen. Are we 5 for 400? Or are we 8 for 120?
The scorecard delivers the brutal truth before you even have your morning coffee. It dictates your mood for the entire day. The tension in those tiny numbers is very real. When the game is played here at home, it is a different vibe. You might be at a Sunday barbecue, sneaking glances at your phone every ten minutes.
The scorecard becomes the main topic of conversation. Someone asks how we are doing, and you rattle off the numbers. You tell them who is batting, who got out cheaply, and whether the pitch is playing tricks.
Reading the Batting Order
When you open up a scorecard, the first thing you see is the batting list. It is usually ordered from one to eleven. The openers are right at the top. The middle order follows.
And the fast bowlers, the guys who usually prefer throwing the ball rather than hitting it, sit right down at the bottom. Here is a look at what a typical top-order batting scorecard looks like during a heated Ashes match.
| Batter | Status | Runs | Balls | 4s | 6s | Strike Rate |
|---|---|---|---|---|---|---|
| U. Khawaja | c Root b Anderson | 137 | 276 | 14 | 0 | 49.63 |
| D. Warner | lbw b Broad | 24 | 35 | 4 | 0 | 68.57 |
| M. Labuschagne | c Bairstow b Wood | 45 | 92 | 5 | 0 | 48.91 |
| S. Smith | not out | 88 | 150 | 9 | 1 | 58.66 |
This table tells a massive story. Look at the Status column first. This tells you how the batter got out. If it says c Root b Anderson, it means Joe Root took the catch and James Anderson bowled the ball.
If it says lbw, that means leg before wicket. The batter missed the ball, it hit their pads, and the umpire decided it was going to hit the stumps anyway. Then you have the runs and the balls faced.
Look at Khawaja in that table. He scored 137 runs, but he faced 276 balls to get there. That means he was out there for hours, wearing down the English bowlers, leaving the good balls, and punishing the bad ones. That is proper test match batting right there.
The Real Meaning of Strike Rates
We need to talk about strike rates. In white-ball cricket, like the Big Bash or T20 internationals, strike rates are everything. You want guys scoring at 150 or more. You want fireworks and massive hits into the crowd.
But in test cricket against a team like England, the strike rate tells a story of survival. If a batter has a strike rate of 40, it means they are scoring 40 runs for every 100 balls they face. It might sound incredibly slow to a casual fan.
But it means they are occupying the crease. They are making the fast bowlers work tirelessly in the hot sun. They are taking the shine off the new ball so the guys batting further down the order have an easier time.
On the flip side, when someone like Travis Head comes to the crease, you might see his strike rate jump to 80 or 90. He plays a totally different game. He attacks the bowlers to change the momentum entirely. The scorecard captures these completely different styles of play side by side. It shows you the anchor and the aggressor in plain text.
The Bowling Masterclass
Now, turn your attention to the bowling stats. This is where the real hard work happens. Fast bowlers running in all day, pounding their feet into the hard Australian dirt, trying to break partnerships.
Let’s break down a typical bowling line to understand what the numbers actually mean when you look at them on the screen or in the paper.
| Bowler | Overs | Maidens | Runs | Wickets | Economy |
|---|---|---|---|---|---|
| P. Cummins | 20.0 | 6 | 45 | 4 | 2.25 |
| M. Starc | 18.5 | 3 | 68 | 3 | 3.61 |
| N. Lyon | 25.0 | 8 | 52 | 2 | 2.08 |
| J. Hazlewood | 19.0 | 5 | 40 | 1 | 2.10 |
If you are wondering what these columns mean, here is a quick guide. Overs are sets of six balls. A bowler can bowl one over, then they have to rest while someone else bowls from the other end of the pitch.
Maidens are the magic number for building pressure. A maiden is an over where the batter scored exactly zero runs. Look at Nathan Lyon in that table. Eight maidens out of 25 overs.
That means for 48 deliveries, the English batters could not get a single run off him. That builds immense frustration. And you know what happens when a batter gets frustrated? They play a rash shot. They take a risk. And that usually leads to a wicket.
Runs are simply how many runs the bowler gave away while they were bowling. Wickets are the ultimate prize. And the economy rate is the average runs given up per over. In test cricket, an economy rate under 3.00 is generally outstanding. It means you are giving away less than three runs every six balls.
The Fall of Wickets
This is honestly my favourite part of any cricket scorecard. The Fall of Wickets, usually written as FOW. It sits right below the main batting stats, usually looking like a confusing string of numbers separated by dashes.
The FOW tells you exactly when a team panicked. Let me explain how it works. A team might be cruising along. They look solid. The commentators are praising their technique. Then, suddenly, the FOW line shows a complete and utter disaster.
- 1-50: The openers did their job. A solid start.
- 2-120: A great partnership. Things are looking comfortable.
- 3-122: A quick wicket. The new batter misjudged the bounce.
- 4-125: Absolute panic sets in. The captain is gone.
- 5-130: The middle order has completely collapsed under pressure.
When you see numbers bunched up closely together like that on the scorecard, you know someone was bowling an absolute spell of magic. Or the batters just completely forgot how to hold a bat under the bright stadium lights. It is the story of momentum shifting in real-time.
The Hidden Match-Killers: Extras
We absolutely need to talk about extras. It is a small line near the bottom of the batting card, right before the total score. But it can easily cost a team the match if they are not careful.
Extras are runs that do not come off the bat. They are free gifts handed to the batting team by the fielding team. There are a few different types you will see recorded on the scorecard.
- No-balls: The bowler overstepped the crease line. The batting team gets a run, and the bowler has to bowl the delivery again.
- Wides: The ball was bowled too far away for the batter to hit it. Another free run and an extra ball.
- Byes: The batter missed the ball, but the wicketkeeper also fumbled it, allowing the batters to run.
I have seen matches where a team loses by five or ten runs, and you look down at the scorecard and see they bowled 15 no-balls. It is a terrible feeling. It shows a complete lack of discipline. And it is all recorded there in black and white forever. You cannot hide from the extras column.
The Wicketkeeper and Fielding Stats
We rarely talk about the fielders when we discuss the scorecard. We mostly focus on the guys holding the bat or the ball. But the fielders are all over that document if you look closely.
Every single time a batter is caught out, the catcher gets their name in the book. If you see the same name popping up four or five times in an innings, you know that fielder was having a blinder. Catching a hard leather cricket ball travelling at 140 kilometres an hour is no joke.
The scorecard quietly rewards the fielders who hold onto their chances. Run outs are also listed. If it just says run out, and lists a player’s name in brackets, it means they hit the stumps with a direct throw, or they combined with the wicketkeeper to catch the batter short of their safety crease.
And then you have the wicketkeeper. A good keeper might not score a century with the bat, but if they take six catches in an innings, they have completely altered the course of the match. Their massive contribution is scattered all throughout the dismissal column.
The Impact of the Pitch
You cannot fully understand a scorecard without knowing a little bit about the pitch they are playing on. The numbers will completely lie to you if you do not have the context of the ground.
If you see a scorecard from the SCG where both teams score 500 runs easily, you know the pitch was flat. It was a batter’s paradise. The ball was coming onto the bat nicely, and the bowlers were suffering.
But if you see a game at the Gabba or over in England at Lord’s where nobody scores over 200, the pitch was probably green. It was offering plenty of movement and bounce for the fast bowlers. The batters were fighting for their lives on every single delivery.
So, when you see a spinner bowling 40 overs in the second innings on day five, you know the pitch is cracking up and turning square. The scorecard reflects the exact ground conditions perfectly, you just have to read between the lines.
Weather and the Dreaded Draw
We cannot talk about an Australian men’s cricket team vs England cricket team match without mentioning the weather. The rain can absolutely ruin a perfectly good scorecard and break the hearts of the fans.
If you see Match drawn at the top of the card, and you notice a team only bowled 40 overs in five days, you know exactly what happened. It poured down. The covers stayed on. The scorecard might show a few batters got decent starts, but the game simply never got going.
In some cases, captains have to get creative with the weather forecast. They might declare their innings closed early to try and force a result before the storm clouds roll back in. The scorecard will show an innings ended with a small d next to the score. It is a bold sign of aggressive captaincy.
Historical Context of Ashes Scorecards
Here is why all of this matters so much. The scorecard from an Ashes test is not just a record of a game played on a weekend. It is a record of a massive cultural rivalry.
When you see the current Australian captain bowl the English captain, you are seeing the latest chapter in a very old, very proud book. The Ashes are about pure national pride. Families stay up late watching it. Pubs are packed with people arguing about it.
And right now, looking at the recent results from the past few years, we have seen some incredible numbers put up on the board. We have seen massive hundreds, devastating spells of fast bowling, and thrilling run chases. And it is all documented on the scorecard.
Reading Digital vs Paper Scorecards
Back in the day, we used to score matches in big paper books with coloured pens. My grandad still does it down at the local club. But now, digital scorecards give us so much more information right in our pockets.
- Digital scorecards update instantly. You do not have to wait for the television graphic to pop up.
- You can click on a batter’s name and see a wagon wheel, showing exactly where they hit every single run on the field.
- You can view pitch maps for the fast bowlers, showing exactly where every single ball landed and how much it swung.
But even with all that fancy new technology, the basic layout of the scorecard has not changed in over a hundred years. The columns are the exact same. The basic stats mean the exact same thing. It is a direct link to the long, weird history of the sport.
The Heartbreak of the 90s
There is one specific thing on a scorecard that hurts more than anything else. Getting out in the 90s. When you look at the batting card and see a player scored 99 runs and then got caught behind.
It is absolute agony. They batted for hours, they did all the hard work, they were one run away from raising their bat to the crowd and securing their name on the honours board. And then they made one tiny mistake.
The scorecard does not show the tears in the dressing room. It just coldly displays the number 99 next to their name. It is a brutal reminder that cricket is a game of extreme patience and harsh realities. You get nothing for free out there.
The Role of the Captain
A cricket scorecard also secretly judges the captains of both teams. When a captain sets a very defensive field, placing players on the boundary rope to stop boundaries, it shows up in the strike rates. The batters have to work much harder for their runs by running between the wickets.
But when a captain plays an aggressive brand of cricket, they set attacking fields. They put three men in the slips. They want to buy wickets. They do not mind if a batter hits a few nice fours, as long as a catch eventually goes to hand.
You can literally see this philosophy in the bowling numbers. You will see high economy rates for the bowlers, because they are giving away runs, but you will also see frequent wickets. The scorecard shows you the captain’s brain working in real-time.
Following the Game From the Pub
If you are catching up with mates on a Saturday afternoon, the scorecard is your best friend. You might have missed the first two sessions of play. You walk into the pub, look at the screen, and you need to catch up fast.
You do not ask who is winning. You look at the current score, you look at how many wickets are down, and you look at who is still left to bat in the shed. If Australia is 4 for 250, and the all-rounders are just coming to the crease, you know we are in a dominant position.
If we are 6 for 90, you quietly order another drink and prepare for a long, painful afternoon. The scorecard gives you the entire context of the day in about five seconds of reading.
The Next Chapter
So, what happens next? The current Ashes series might be over, or maybe it is just getting started. The cycle of cricket never really stops for long.
The players will go back to their state teams. They will play domestic cricket. But eventually, the Australian men’s cricket team and the England cricket team will meet again on the grass. And when they do, there will be fresh, blank scorecards waiting to be filled.
We will definitely see new young players make their debut. We will watch old, tired legends retire from the game. The names on the sheet will change, but the format of the numbers will stay exactly the same. That is the beauty of it.
Wrapping Your Head Around It All
If you are completely new to the sport, do not let the massive wall of numbers overwhelm you. Just start by looking at the runs and the wickets. Find out who scored the most, and who took the most wickets.
Everything else will start to make sense over time. Watch a game on the television and keep the live scorecard open on your phone in your lap. Match up what you see happening on the screen with the numbers appearing on the page. It is the absolute best way to learn how the game flows.
And remember, every single dot ball, every boundary hit into the stands, and every dropped catch in the slips matters. It all adds up to the final result. None of it is pointless.
Frequently Asked Questions
Where can I find the live scorecard for Australia vs England?
You can find live scorecards on major sports websites or dedicated cricket apps. They update ball by ball, so you never miss a thing even if you cannot watch the broadcast.
Who usually scores the most runs in these matches?
It changes every series, but the top-order batters usually get the big numbers. Guys who bat at number three or four tend to build the biggest innings once the new ball gets old.
What does FOW actually mean on a cricket scorecard?
FOW stands for Fall of Wickets. It shows the batting team’s total score at the exact moment each batter was dismissed by the bowling side.
How do you read the bowling economy rate?
The economy rate is just the average number of runs a bowler concedes per over. An economy rate under 3.00 is generally considered excellent in a five-day Test match.
Why do fast bowlers sit at the bottom of the batting list?
Fast bowlers are selected for their ability to take wickets, not score runs. They usually lack the batting technique to face fresh fast bowling, so they bat last when the ball is older.
What happens if a match ends in a draw?
A draw happens if five days of play are completed and neither team has won, often due to rain delays. It is different from a tie, which happens when the scores are exactly level.
How are extras counted on the final scorecard?
Extras like wides, no-balls, and byes are added to the team’s total score, but they do not count towards any individual batter’s personal run tally. They have their own row at the bottom.
A Final Thought on the Numbers
Look, we can sit here and talk about batting averages and bowling strike rates all day long. But at the heart of it, the Australian men’s cricket team vs England cricket team match scorecard is just a reflection of pure human effort.
It represents hours of standing out in the hot summer sun. It is the physical sting of a fast ball hitting the wicketkeeper’s gloves. It is the immense mental relief of making it to the lunch break without losing a crucial wicket.
Next time you glance at the scores on your phone, take a minute to really read them. Look past the big hundreds and the five-wicket hauls. Look at the guy who batted for two solid hours for just 15 runs to save a draw. Look at the bowler who sent down 10 maidens to build pressure for his teammates.
That is where the real beauty of the game lives. The rivalry between the two nations continues, the banter goes on, and the scorecards will always be there to keep the receipts for the next generation of fans.


Leave a Reply